
Why I'm Excited About Q2 2021
5 charts that make me extremely bullish

Bitcoin and Ethereum have both been ranging for the last month. It seems like it’s been forever since Bitcoin has set a new all time high. Ethereum finally hit a new all time high today. After what happened during December through February, this can seem anti climatic. But it seems like the next 3 months could bring more fireworks. Here are some reasons I’m excited.
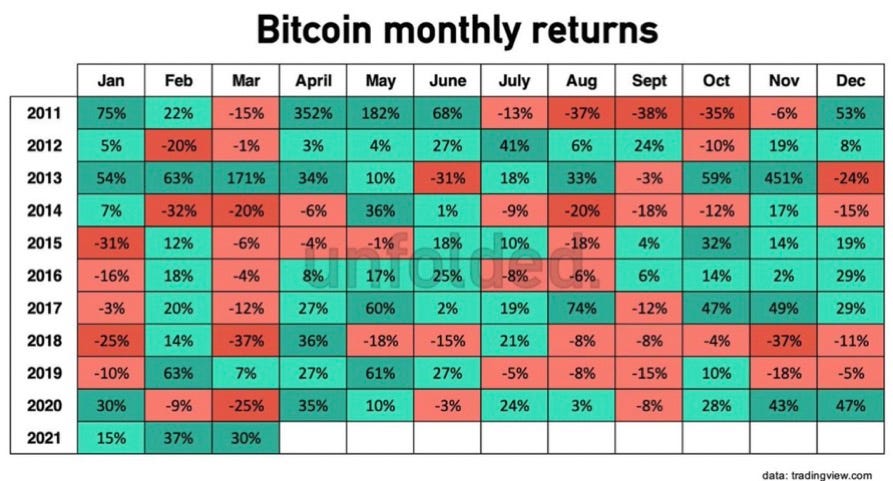
First off, Q2 is a historically bullish time for Bitcoin and crypto in general. If you look at the Bitcoin Monthly Returns image below, you will see that Bitcoin has had positive returns in all but 2 Aprils of all the years Bitcoin has been around. Plus, you can see that May has historically been a great month as well. May is also when the main crypto conference, Consensys, is held. It will be held this year during May 24-27th.
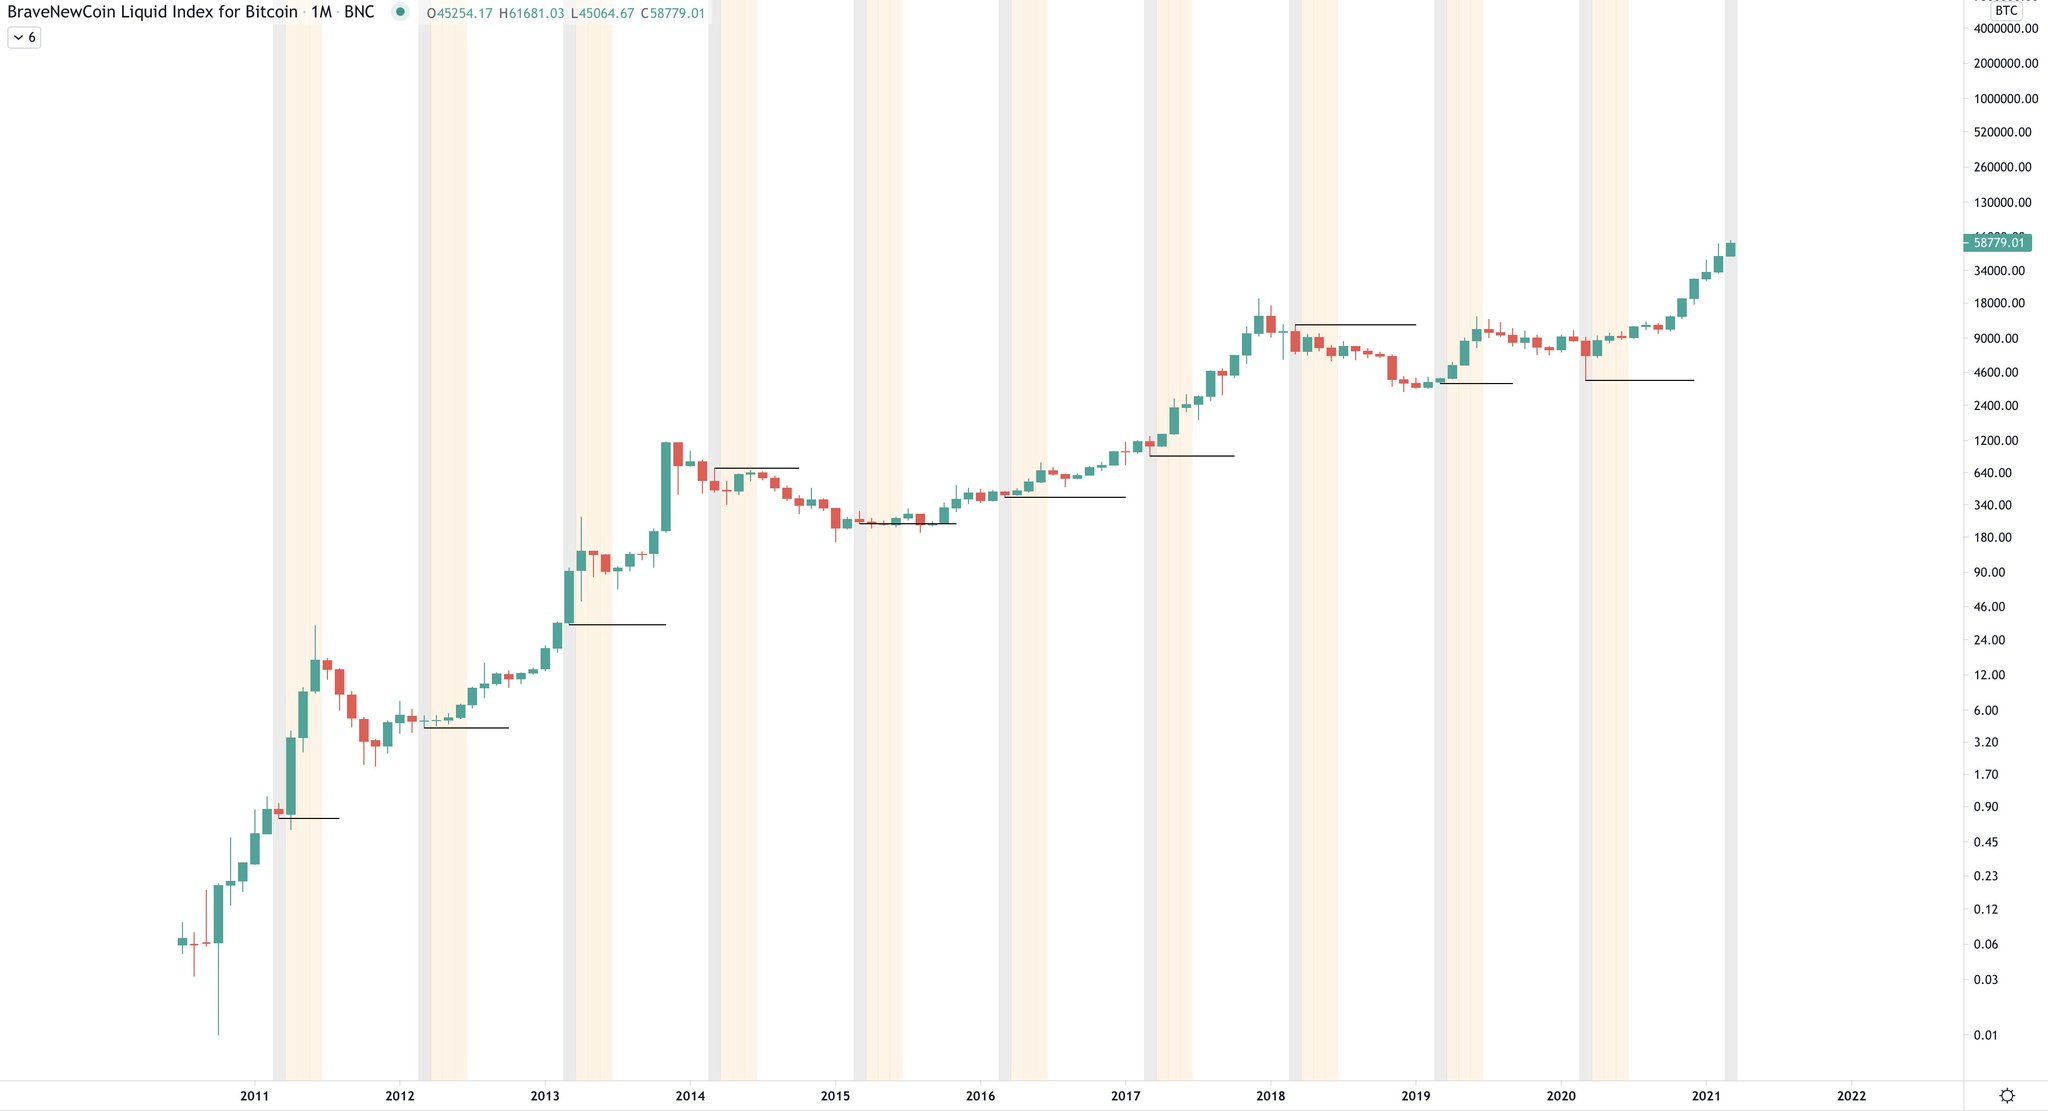
Another reason to be bullish for Q2 is to view the Bitcoin chart below. The gray bars highlight the month of March every year and the orange sections highlight the 2nd quarter of each year. You will notice that historically, March isn’t a very good month for Bitcoin, but the March high/low (depending on trend direction) is rarely challenged/broken with conviction. (Thanks to @BTC_jacksparrow for this insight).
Now, before you go buy more Bitcoin or convert all your other crypto coins into Bitcoin, there’s important chart I need to show you below. It’s the Bitcoin Market Cap Dominance chart. This chart shows how much of the total cryptocurrency market cap is dominated by Bitcoin’s market cap. This chart shows that Bitcoin’s market cap is currently at 60.80. This means Bitcoin’s market cap is 60% of the total cryptocurrency market cap. You will notice that the price has broken below the green diagonal line and it heading towards 54.58 and possibly as low at 42.20. What does this mean?

If this chart goes down, it means other cryptocurrencies like Ethereum, Litecoin, Chainlink, and others will be out performing Bitcoin. This is called in the crypto sphere “Alt Season”. All coins besides Bitcoin are consider ‘Alt Coins’. So the previous two charts suggest Bitcoin should continue to go up, and this chart shows that all other cryptocurrencies should out perform Bitcoin. If this is the case, the crypto market is going be on FIRE!
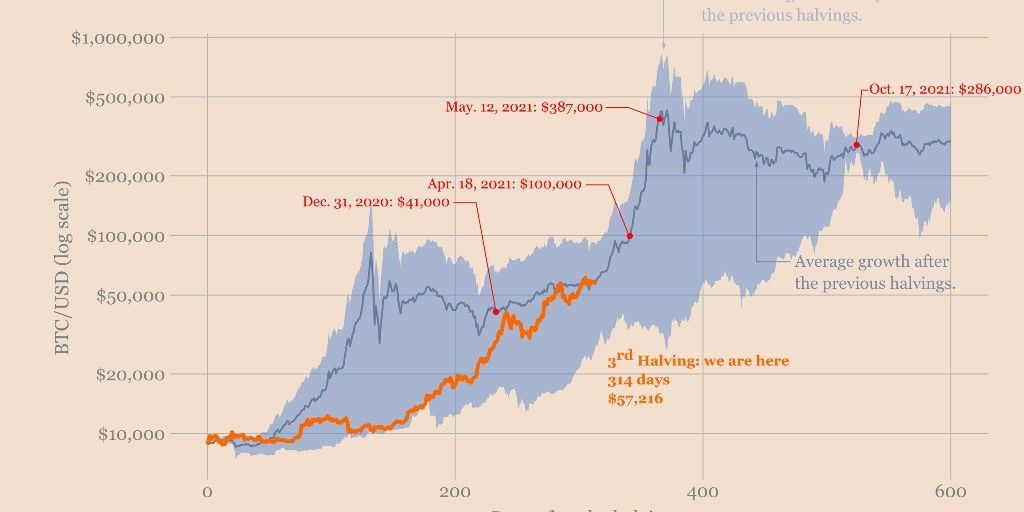
The last two charts I want to show you are more based on Hopium more than anything fundamental. You should take them with a grain of salt, but it’s always fun to hope and dream. This first chart shows a blue area which is the difference between the bull runs of 2013 and 2017. The orange line (Price of Bitcoin since the halving in May 2020) is used to show how it compares to previous bull runs. If Bitcoin keeps up with the average price (dark blue line) Bitcoin would hit $387,000 in May. To be honest, this seems very unlikely. I’d be ecstatic if Bitcoin reaches $286,000 in October 2021.
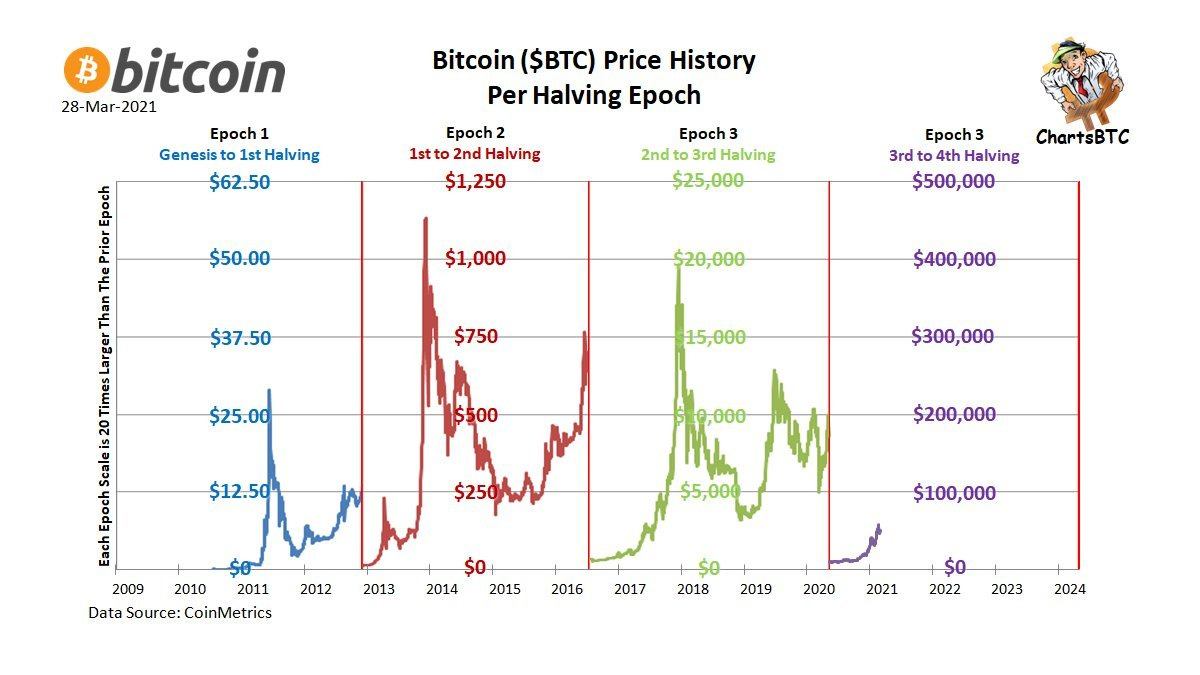
And lastly with have a pretty epic chart below. Each section shows the price action of Bitcoin during each halving period. And each period is multiplied by 20x the previous period. When putting the price action of Bitcoin in this perspective, it makes $200,000 Bitcoin seem pretty reasonable.
Again, I have to admit, this is purely speculation, but a guy can dream! Hopefully, these charts have helped you see what is possible. I’ve seen it over and over again, people underestimate the upside of Bitcoin and overestimate the downside.
Hope everyone has an enjoyable Easter weekend! I’m out on vacation next week for Spring Break. Until next time!
Best,
Spencer