
Feb. 27 Checklist
"It's merely a flesh wound"

Well as you’ve noticed, I’m late getting this week’s newsletter out. I wanted to wait til things calmed down before I said anything premature.
So here it goes:

Sentiment: Everyone is bearish and it feels like everyone is about ready to call it quits and hunker down for the next bear market. And the crazy thing is this pullback has only been around 25%. In every other bull market, there have been multiple 25-33% pullbacks. So this is not out of the ordinary. According to sentiment, I think the bottom is in, or it’s close.
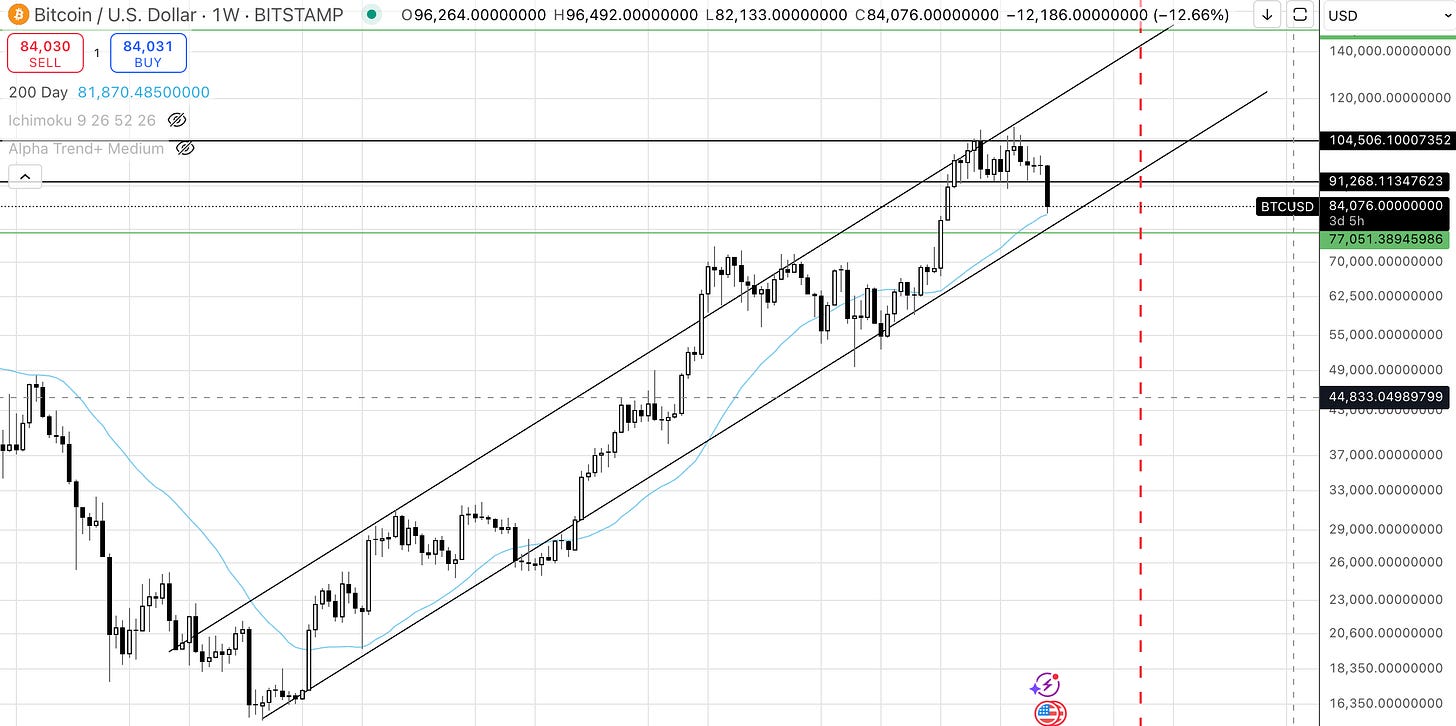
200 Day Moving Average is around $80. The main thing we want to watch is staying above the 200 day moving average. If we close the week below the 200 day moving average, that would be bad. For now, we are in the clear.
Nasdaq chart structure is still bullish. Trend line in tact. We are still making higher highs and higher lows.
The same stands for the S&P chart structure.
Elliot Wave Theory - We are in the 5th wave of the 5th wave. We’re definitely getting closer to the end. But we should still see one more impulse move up. At that point, the signal will turn red
Bitcoin Chart - (see image below) Bitcoin broke below the support we had a $91k, which isn’t great. But it touched the 200 dma (blue line) and bounced, plus, as you can see, we are still within the trend line channel dating back to Nov. 2022. According to this, there’s no reason to panic, but definitely reason to be cautious.
Interest Rates: Interest rates continue to fall, which is a good sign and should help Bitcoin climb higher over the coming months.
Dots System - The Dot system lost its green dots. It’s giving a sign of caution. You can read more about it HERE.
RSI - The RSI isn’t telling us anything at this point. We want to pay attention to the when the RSI gets near 70 again.
Ichimoku Cloud - this pull back brought us back to equilibrium.
Gold vs BTC Chart: The pullback brought this chart back to the 200 day moving average. It’s acting as resistance. I expect Bitcoin to outperform Gold moving forward.
S&P/BTC Chart: We are still making lower highs and lower lows, nothing concerning here right now.
Nasdaq/BTC Chart: We are still making lower highs and lower lows, nothing concerning here right now.
MSTR chart: MSTR also came back to it’s 200 day moving avg. Nothing moves in a straight line. Even though I’m not super bullish on MSTR, I could see MSTR bouncing back above $300 as Bitcoin runs back above $100k.
Yield Curve: When the yield curve inverts, everyone freaks out about it being a signal for an upcoming recession. But the recession doesn’t hit until after the yield curve UN-INVERTS, which it recently did. This makes me think we see a recession in the next 6-9 months, which means we could be close to the top in Bitcoin in the next 3-6 months.
Parabolic Advance Structure: Check out the chart below, trend line is still in tact.


Bitcoin Dominance (BTC.D) - This chart is probably the biggest reason I’m still bullish. This chart is topping, not bottoming. We’ve never had a market top with this chart topping. This is a double green light!
DXY Chart - DXY is breaking down in a really good way. This is also good for Bitcoin.
Ultimately, this pull back is normal. Structure is in tact. I expect Bitcoin to bottom out over the next week and then March and April will bring new all time highs! Let me know what you think!