


Bitcoin is a Value Investment at $13,000!
Three valuation models provide evidence that bitcoin is a great buy at these prices.

People frequently complain that there is no intrinsic way to value bitcoin. Others might look at Bitcoin with a price of $13,000 and think, “wow, bitcoin is getting SOOOO expensive, there’s no way I’d buy it when it’s this high”. In today’s newsletter we discuss why Bitcoin and Ethereum are both great values right now for a long term investment horizon.
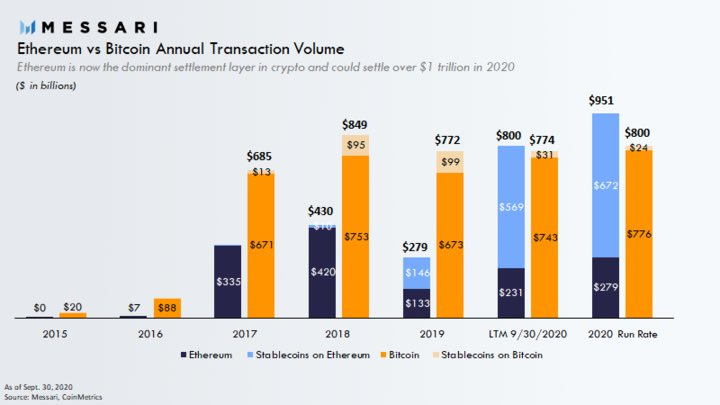
Messari recently released some interesting numbers around total transaction volume on Bitcoin, Ethereum and stablecoins. In case you don’t know what a stablecoin is, it’s simply a dollar denominated cryptocurrency built on the Bitcoin or Ethereum blockchain. Its price is fixed and does not fluctuate. They are becoming a major tool in the crypto space.
As you can see in the chart below, we are starting to see incredible transaction volume across these currencies. Both Bitcoin and Ethereum are approaching $1 Trillion of transaction volume in 2020.
This made me think, how does this compare to other payment platforms like Visa, MasterCard and PayPal. In the chart below I calculated each platform’s Total Transaction Volume and it’s associated Market Cap. Visa’s total transaction volume is close to $2 trillion with market cap just over $400 billion. It’s interesting to note that MasterCard, American Express, PayPal, Bitcoin, and Ethereum are all on pace for $800 billion in total transaction volume in 2020. MasterCard, PayPal and Bitcoin have comparable market caps ranging from $230 - 320 billion.

So if we value Bitcoin just on its transaction volume, its valuation is right in line with other payment platforms. But Ethereum’s market cap looks to be significantly lagging when you look at its total transaction volume. You may consider Ethereum to be undervalued, and maybe a good investment opportunity.
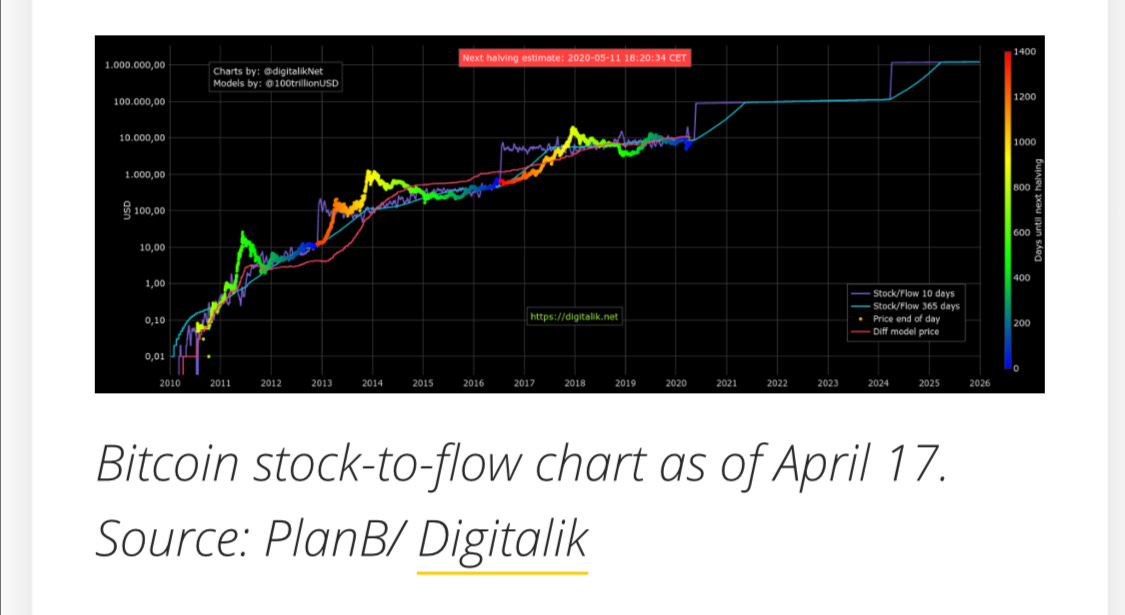
As for Bitcoin, it is so much more than a payment platform. Since its quantity is limited to 21 million units, it’s seen as a store of value. PlanB released a model in 2019 called the Stock to Flow model that models out assets’ market cap compared to its stock to flow ratio. I’ve included a chart below and you can read about the model here. In short, the model states that bitcoin stock to flow ratio (or measure of scarcity) is similar to gold’s, which would give bitcoin a market cap close to $10 trillion. This would put bitcoin’s price around $250k. So even if bitcoin only reaches $50-100k, you’re still looking at a 3.8x-7.6x return if you buy at $13k.
In real estate there are two common ways to value a property. You can look at comparable properties or estimate what it would cost to build the property from scratch. My first valuation model above compared bitcoin to other payment platforms. This last valuation model calculates the cost of creating a bitcoin from scratch, which is the price to mine bitcoin. According to this article the cost to mine new bitcoin in 2020 is approaching $12,500.
So looking at these three valuation models, buying Bitcoin and Ethereum at these prices seems pretty reasonable. But what do you think?
If you’re looking for more formal crypto education or simply want a guide to successfully investing in the space, reach out to me at uintacrypto@gmail.com to learn about my new course offering.
This Week’s Price Action
Well it looks like last week’s price analysis was spot on. Doesn’t happen every time, but it’s fun when it does. This week, Bitcoin rallied up to $13.8 and is oscillating about $13.3. My forecast has us topping out somewhere between $14.5k and $16k. I will be starting to sell through that range. We could see Ethereum start to catch up as well, but it’s too early to tell. If Bitcoin screams higher, the fall afterwards could be just as violent, so watch out. I will look for a drop back to around $11,000.
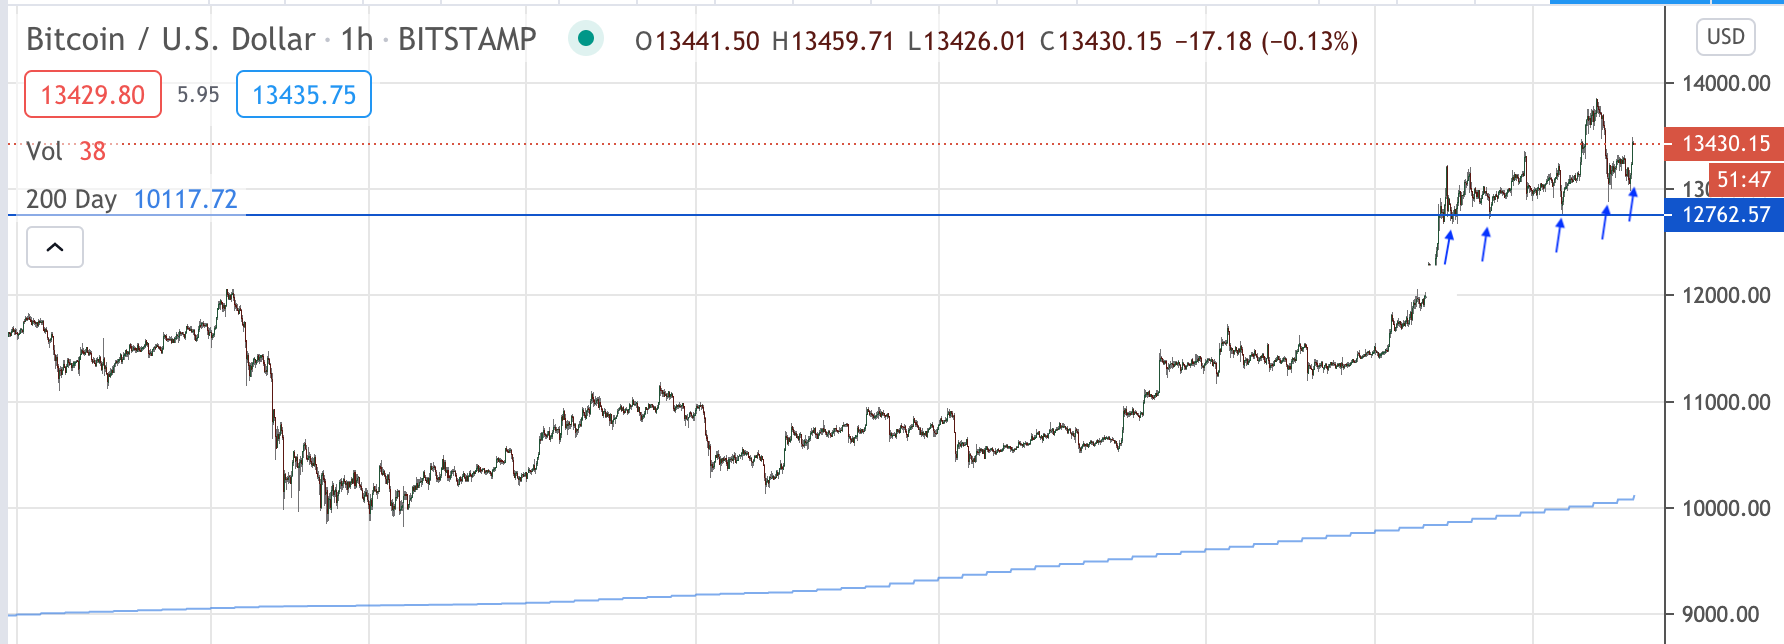
As you can see in the chart above, on the 1 hour candle chart, Bitcoin is making higher lows. This is building a good base for a break out higher. It’s also staying about the support line of $12,762. This support line used to be the resistance line that marked the tops in June 2019 and Feb. 2018. This is a significant price point for traders. As long as we stay above, things look promising.
As for Ethereum, it’s important to continue looking at the ETH/BTC chart below.

As you can see, Ethereum continued to decrease compared to bitcoin over the last week. Now it’s sitting at support and just touched the 200 day moving average (light blue line). This could mark the point where Ethereum starts to catch up to Bitcoin. It’s till too early to tell, but that’s what I’ll be watching. As long as Ethereum is weak compared to Bitcoin, all other coins will be weak as well. Right now, Bitcoin is king!
Hopefully, this was helpful! Please let me know if would like to join my course to help you successfully navigate this space.
A lot will happen between now and the next newsletter. Go out and vote!
Best,
Spencer