
Bitcoin Checklist - Mar. 5, 2025

What a wild week. We had markets tanking last Friday and Saturday. Then Trump made an announcement about the Crypto Reserve on Sunday shooting everything up 10%, and then on Monday everything crashed back down due to tariffs.
With all this volatility, it’s easy to let emotions get the better of you. That’s why we need a data based approach to keep us grounded. Let’s go over the list.

Sentiment is horrible, which is what we want to see. The current sentiment level usually marks market bottoms, not tops. The image below is the sentiment for the S&P. Since crypto goes the way of S&P, this is useful. (Green Light)

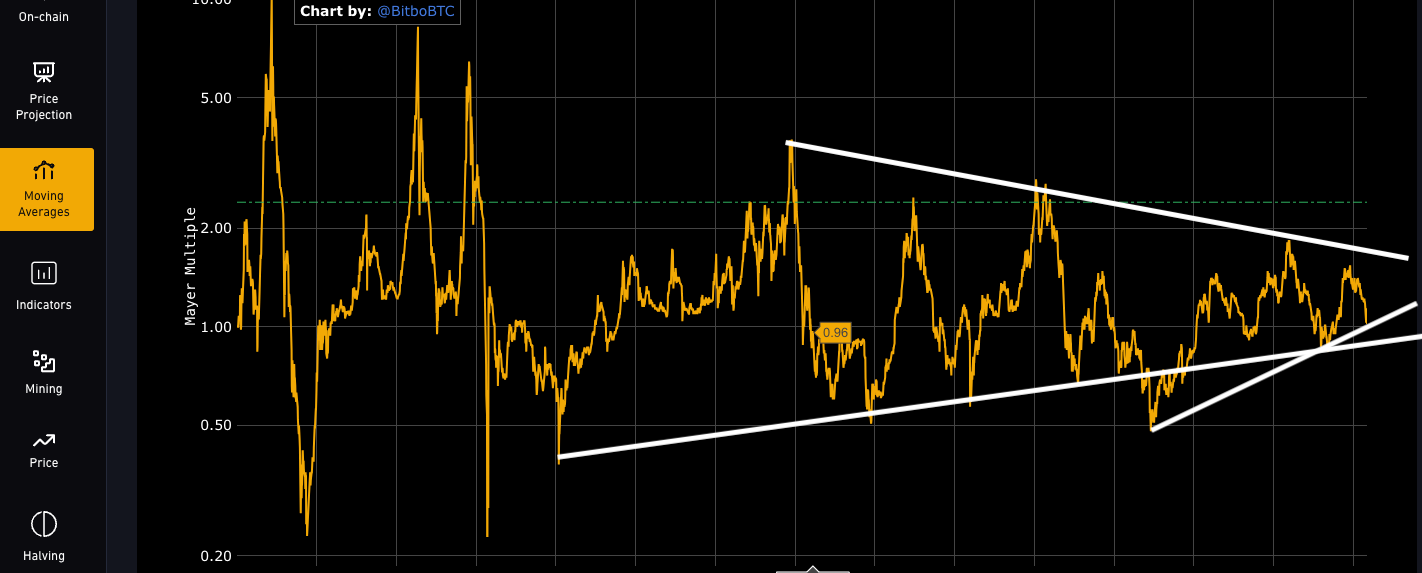
200 Day Moving Average is around $80k. We have bounced off the 200ma twice now, which is good. The image below is of the Mayer Multiple. The market tops when it gets to the trend line (white line), we aren’t even close. (Green light)

Nasdaq chart: we are above the 200 sma and above the trend line. (Yellow light)
The same stands for the S&P chart structure. (Yellow light)
Elliot Wave Theory - We are in the 5th wave of the 5th wave. We’re definitely getting closer to the end. But we should still see one more impulse move up. (Yellow light)
Bitcoin Chart - Last week’s chart with the super long candlestick wick that went down to $78k was wild. The wick alone was $16k. We’re creating another long wick on this week’s candlestick. Everything is dependent on Friday for the White House’s Crypto Summit. We are kind of in no man’s land right now. We really want to close the week above $90k ($88k worst case scenario, but still bullish) (Yellow Light)
Interest Rates: Interest rates continue to fall, which is a good sign and should help Bitcoin climb higher over the coming months. (Green Light)
Dots System - The Dot system lost its green dots. It’s giving a sign of caution. You can read more about it HERE. (Yellow Light)
RSI - The RSI isn’t telling us anything at this point. We want to pay attention to the when the RSI gets near 70 again. The top could happen the next time RSI hits 70. (No Light)
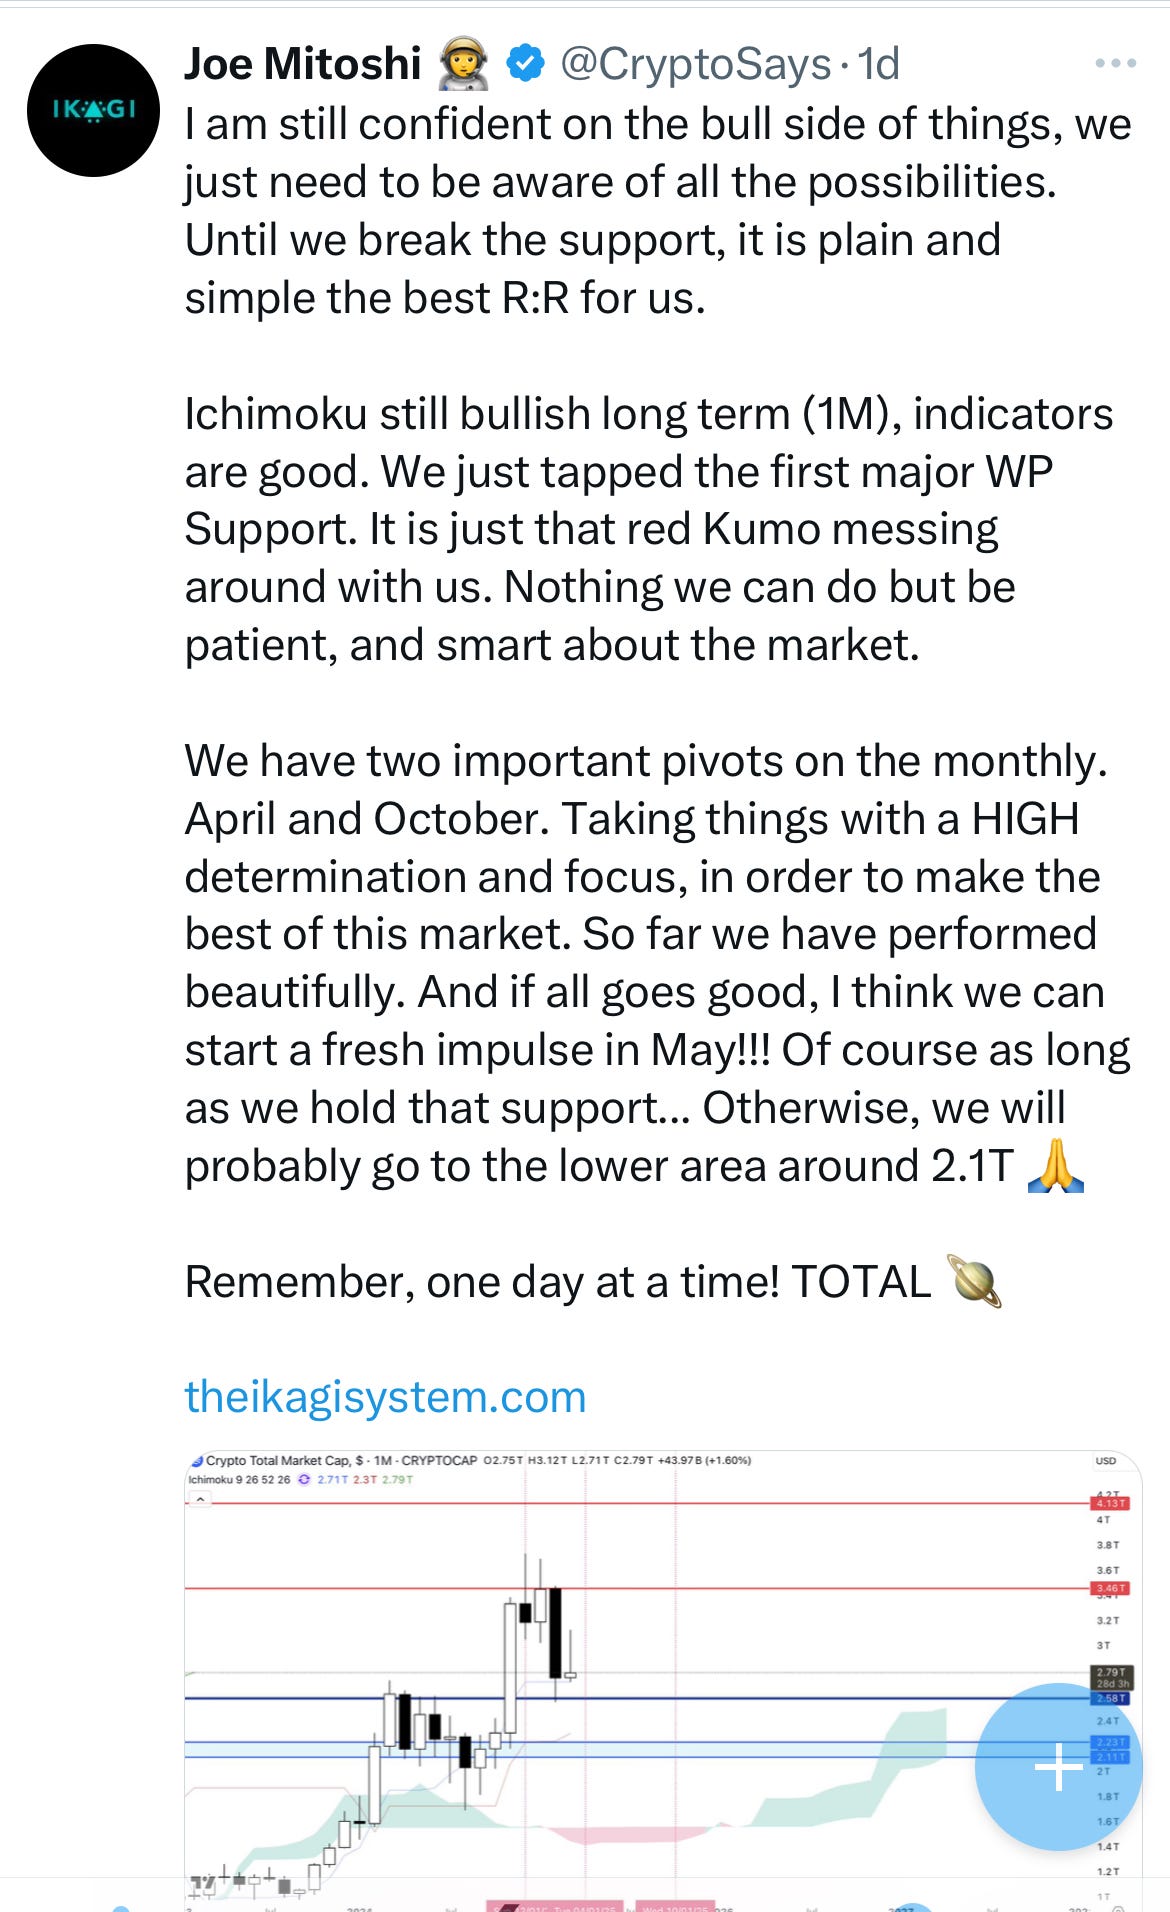
Ichimoku Cloud - this pull back brought us back to equilibrium. According to CryptoSays on X (pictured below) the Ichimoku is still bullish. (Green Light)
Gold vs BTC Chart: The pullback brought this chart back to the 200 day moving average. It’s acting as resistance. Also, continuing to make lower highs. (Green light)
S&P/BTC Chart: We are still making lower highs and lower lows, nothing concerning here right now. (Green Light)
Nasdaq/BTC Chart: We are still making lower highs and lower lows, nothing concerning here right now. (Green Light)
MSTR chart: It has bounced really well off the 200 sma. It’s hitting up against resistance. I am confident that MSTR will not make new highs, but if Bitcoin goes on a run, MSTR could go back up to $350. (Yellow Light)
Yield Curve: When the yield curve inverts, everyone freaks out about it being a signal for an upcoming recession. But the recession doesn’t hit until after the yield curve UN-INVERTS, which it recently did. This makes me think we see a recession in the next 6-9 months, which means we could be close to the top in Bitcoin in the next 3-6 months. (Red Light)
Parabolic Advance Structure: Still in tact (Green Light)
Bitcoin Dominance (BTC.D) - This was my bigget reason for being bullish last week. As you can see in the chart below. It has been trending up since beginning of 2022. That’s 3 years. If Bitcoin and crypto top out here, this chart would continue to go up. It’s hard for me to believe this isn’t topping out. So I still give this a Green Light. We want to see this chart break down. The candle stick from 5 weeks ago, with the long wick, is a topping signal. (Green Light)

DXY Chart - DXY is breaking down in a really good way. This is also good for Bitcoin. (Green Light)
Overall, the main concern lies with what the stock market does, which is extremely volatile right now due to the situation with tariffs. But again, according to extremely bearish sentiment, the stock market might have bottomed.
I’ve been following David Hunter on X for over 3 years and he has not wavered in his call for the S&P to reach 7000 and he is still very confident that the top of the market is still to come.
Things are precarious, but nothing is signaling the need to sell!
Let me know what you think!